
My Power BI icon library

Updated: Aug 17
It has been a long time desire of mine to create a full set of icons I could use within my Power BI reports and have them readily available for usage in all of our solutions. Over the years, I've used various ways to insert icons into reports, but it's been inconsistent and too much work.
I finally got around to it, so am happy to share the process and the results with you!

To fast track to the ending, I've generated a binary block of text that Power Query reads and converts into the table of the 1,000 icons. The file is stored in a publicly accessible Azure storage container, so I can update it any time, and all semantic models will be updated with the new/edited ones upon next refresh!
Now, let's go back to the beginning and I'll walk you through to the end!
The Preparation
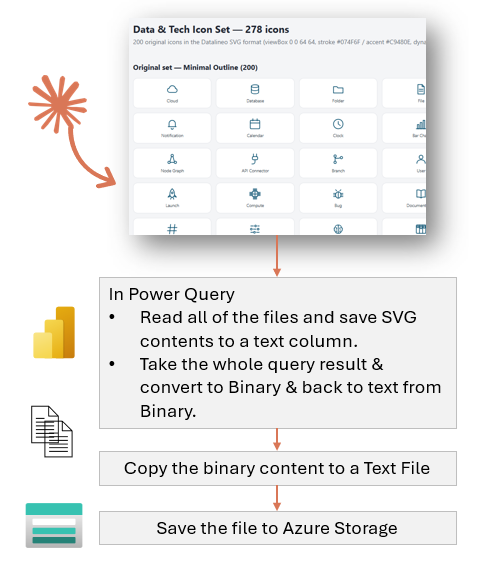
First step was to generate a set of icons and thanks to my good friend Claude, I had around 900 icons generated, across a number of categories. It took a few goes to ensure I got a good mix and some of them didn't come out great. But even with all that back and forth it was less than an hour - all custom created for me! The output was a zipped file of SVG files, in sub-folders according to their category.
Rather than save all of those files to a public storage container, I wanted to convert them to a binary text and, with some handy Power Query functions, it converts back into a table of data, with the svg content as a text column. Why store as binary text and not just read the files from the storage container? The binary text is 130kb and all of the files are 2.2MB, so it's purely for efficiency.
The result set is a block of text that Power Query will be able to read and transform back into a result set. So I save that in a file and it's uploaded into a public container.
Here is a view of the query that reads the files and converts to binary text.
let
    Source = SharePoint.Contents("https://xx.sharepoint.com/sites/development", [ApiVersion = 15]),
    icons = Source{[Name="icons"]}[Content],
	// Expand all files in the folders, use the folder name as the Category
    SelectFileData = Table.SelectColumns(icons,{"Content", "Name"}),    RenamedColumns = Table.RenameColumns(SelectFileData,{{"Name", "Category"}}),
    ExpandedContent = Table.ExpandTableColumn(RenamedColumns, "Content", {"Content", "Name"}, {"Content", "Name"}),
    SelectMainColumns = Table.SelectColumns(ExpandedContent,{"Category","Content", "Name"}),
    SVGName = Table.TransformColumns(SelectMainColumns, {{"Name", each Text.BeforeDelimiter(_, ".svg"), type text}}),
	// Read the SVG content and add as a text colum
    AddSVGText = Table.AddColumn(SVGName, "svg", each Text.Combine(Lines.FromBinary([Content]),""), type text),
    SelectFinalColumns = Table.SelectColumns(AddSVGText,{"Category", "Name", "svg"}),
    StopFolding = Table.StopFolding(SelectFinalColumns),
	// Convert the result set to a binary text, which is pasted into a .txt file
    ToJson = Json.FromValue(StopFolding),
    Compressed = Binary.Compress(ToJson, Compression.Deflate),
    AsText = Binary.ToText(Compressed, BinaryEncoding.Base64)
in
    AsText
Once that file is uploaded, any Power BI semantic model can include the query to load these and have readily available for usage in reports.
The Usage

Within any Power BI semantic model, I can paste the query below and the data is loaded ready for usage.
Within the model, I created two calculated measures, which I can drop into visuals and they render nicely. I need two measures because standard Power BI Visuals like the table and card visual need the svg content prefixed with "data:image/svg+xml;utf8,". The other measure doesn't include that prefix and is for the HTML Lite visual, with thanks to Daniel Marsh-Patrick's efforts in it's development.
Take a look at these report pages which showcase the icons. It's an embedded Power BI report, so you can multi-select yourself to see it in action.
Here is the query that reads from the source file and converts ready for usage in your semantic model. Just paste this into a Power BI model and it'll work straight away! You can authenticate Anonymously as it's open.
let
    EncodedText =
Text.FromBinary(
AzureStorage.BlobContents("https://lineoimagestore.blob.core.windows.net/publicfiles/datalineo-icon-library/DatalineoIconLibraryShared.txt")
),
    Decoded = Binary.FromText(EncodedText, BinaryEncoding.Base64),
    Decompressed = Binary.Decompress(Decoded, Compression.Deflate),
    Parsed = Json.Document(Decompressed),
    AsTable = Table.FromRecords(Parsed),
    ChangedType = Table.TransformColumnTypes(AsTable,{{"Name", type text}, {"Category", type text}, {"svg", type text}})
in
    ChangedType
Here are the two calculated measures needed in the semantic model. The HTML version is only needed if you plan to drop an icon onto a report page as a stand-alone image (they look great and perfectly resizable). The measures need to be set as "Image URL" in the Data category to they render as an image.
SVG HTML = SELECTEDVALUE('Datalineo Icon Library'[svg])
SVG Visual = "data:image/svg+xml;utf8,"&[SVG HTML]
Extending the icons
In some reports, I wanted to use the Fabric icons as we embed report usage, metadata and some architectural visuals into customers' reports. Having the official Microsoft Fabric icons would be nice, so I have added them too. These are based on the official set available here: Fabric product, workload and item icons.
I may continue to extend these with other icon sets too such as Azure or Power Platform.
Model Impact
One drawback that should be noted, is that 1,000 rows of different svg text does not compress well. The data size is just under 450kb, which will inflate your model size. It's up to you if that is too much.
One tip - you can set the query so "Include in report refresh" is disabled. That way, if your model refreshes multiple times a day, the icons are skipped. That enables you to refresh them on an ad-hoc basis via the API when you know changes have been made to the source file. Even better, automate the icon query refresh when the source file changes. 😉
Next steps
The process to read and generate the binary text and save to Azure storage is a bit manual, so I may move this to be fully automated. I did want to blog at this point though, as it's a better explainer to the moving parts than a fully end-to-end automated script.
Available for you
I created a sharable version of the icons for you. The source file is publicly accessible (see below) and I will leave it in that location for as long as I can.
The Power BI Report above is also available in my GitHub, so feel free to download so you can get a working version of these to try out.
Conclusion
The process is a bit manual and clunky at the moment, but the end-result is great. I can revisit the process and streamline it, so it becomes more CI/CD flavour. But for now it won't change much so I'll park that for another day.
Links
The Power BI sample file


Comments